
ECONOMIC VALUE ADDED (EVA)
Economic value added (EVA) is the measure of a company’s financial performance based on residual wealth.
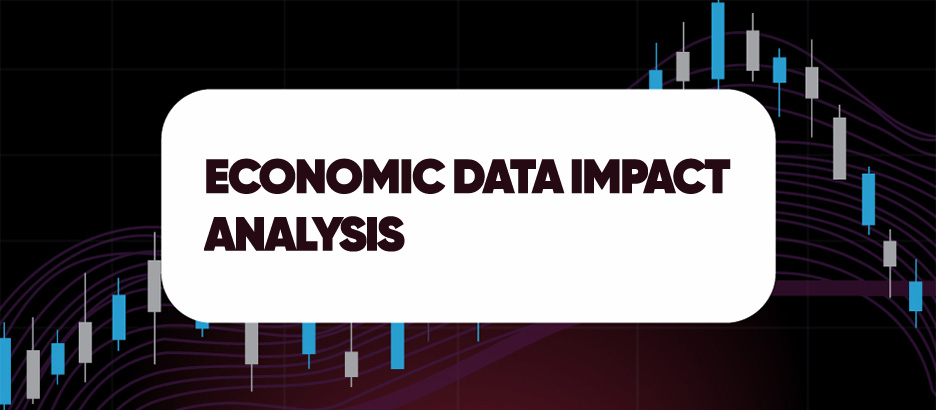
Economic Indicators
Definition: Economic Data Impact Analysis assesses how macroeconomic indicators influence financial markets, investment decisions, and economic trends. This process involves evaluating key economic data releases such as GDP growth, inflation, interest rates, employment reports, and consumer sentiment. Traders and investors use this analysis to predict market reactions and adjust their strategies accordingly. Understanding economic data impact helps in risk management and long-term investment planning.
Importance: Economic data releases play a critical role in shaping financial markets by influencing investor sentiment and policy decisions. Analyzing these impacts allows traders to anticipate volatility and position themselves strategically. Central banks and policymakers rely on economic indicators to adjust monetary policies, affecting interest rates and liquidity conditions. Investors use economic data to refine asset allocation and risk exposure. Keeping track of economic reports ensures that market participants stay ahead of major financial developments.
Tips: Follow an economic calendar to track key data release dates and times. Compare market expectations with actual economic data outcomes to gauge potential price movements. Assess how different asset classes respond to various economic indicators. Use historical data analysis to understand how past economic releases have impacted market trends. Be mindful of geopolitical events that may amplify the effects of economic data releases.
Definition: At the transaction level, Economic Data Impact Analysis evaluates how macroeconomic indicators affect individual trades and order execution.
Formula: Transaction-level economic impact is measured by assessing price volatility, bid-ask spreads, and liquidity shifts following economic data releases.
Example: A sudden rise in inflation data may lead to increased market volatility, affecting trade execution prices.
Application: Traders monitor economic data impacts at the transaction level to adjust order timing and avoid excessive slippage.
Definition: Economic Data Impact Analysis at the trade level assesses how macroeconomic conditions influence trade performance over multiple transactions.
Formula: Trade-level economic impact is determined by comparing pre- and post-economic data release trade performance.
Example: A trader analyzing trades executed before and after a central bank rate decision may observe shifts in market trends.
Application: Traders use trade-level economic impact analysis to refine their strategies and anticipate future price action.
Definition: At the portfolio level, Economic Data Impact Analysis evaluates how macroeconomic trends influence portfolio performance and risk exposure.
Formula: Portfolio-wide economic impact is assessed by analyzing correlations between economic data and portfolio asset returns.
Example: A portfolio heavily invested in equities may experience heightened volatility following an unexpectedly weak jobs report.
Application: Portfolio managers use economic data analysis to adjust sector allocations and hedge against potential downturns.
Q: Why is Economic Data Impact Analysis important for traders?
A: It helps traders anticipate market reactions and adjust their positions accordingly to minimize risks and maximize opportunities.
Q: What are the most influential economic indicators?
A: GDP growth, inflation rates, employment data, central bank decisions, and consumer sentiment reports are among the most impactful indicators.
Q: How can investors use Economic Data Impact Analysis for long-term planning?
A: Investors analyze economic trends to optimize asset allocation, hedge risks, and align their portfolios with macroeconomic conditions.